Showing posts with label stoopidstats. Show all posts

Wednesday, February 25, 2026

the alphabetic struggle for the presidency


Political historians tend to divide American history into eras — Founding, Reconstruction, the New Deal, the Cold War, the modern age. These divisions track ideology, party realignments, wars, and economic upheaval.

But beneath those visible shifts lies a quieter contest — measurable, cumulative, and surprisingly dramatic.

The running total of letters in the surnames of Presidents of the United States.

By counting, day by day, the cumulative occurrence of each letter across administrations, a pattern emerges. The results are not random. They form arcs. They show reversals. They reveal consolidation and realignment.

What follows is the verified history of the struggle for alphabetical supremacy.

The Founding Volatility (1789–1825)

The republic begins with N in the lead, thanks to the two N’s in Washington. The early administrations of Washington, Jefferson, and Madison allow N to establish an initial advantage.

That stability proves short-lived.

In 1801, under John Adams, A briefly takes the cumulative lead — the only time in American history that A sits atop the standings. The moment is fleeting. Later that same year, under Jefferson, N reclaims the lead.

The early republic is not yet settled. Margins are small. A single presidency can alter the balance.

In 1825, during the administration of Monroe, O overtakes N for the first time. At this point, it might appear that O’s long reign has begun.

History, however, remains unsettled.

The Nineteenth-Century Tug-of-War

The middle of the nineteenth century reveals a system in flux.

In 1837, under Van Buren, N retakes the lead.
In 1853, under Fillmore, O reclaims it.
In 1857, under Buchanan, N takes it back again.

The margins during this era are narrow, and leadership changes hands through incremental accumulation rather than dramatic surges. No letter establishes durable supremacy. The system oscillates.

This is the Alphabetic Reconstruction Period — unstable, competitive, unresolved.

The Roosevelt Realignment (1933)

The next decisive shift comes in 1933.

Under the second Roosevelt, O retakes the cumulative lead. Unlike earlier reversals, this one holds. For more than five decades, O remains on top.

The twentieth century does not invent O’s strength, but it consolidates it. Coolidge, Hoover and Roosevelt reinforce what had previously been contested ground. From 1933 forward, O governs the cumulative standings with quiet durability.

Other letters rise but do not displace it.

The Eisenhower Acceleration and the E Near-Miss

The closest challenge to O during its long reign came not from N, but from E.

The groundwork was laid by eight years under Eisenhower — the only instance in presidential history in which a single letter appears three times in a surname. No other administration has produced such concentrated orthographic reinforcement.

Those years produced a measurable compression of the gap between E and O. And that continued under Kennedy with his two E's. By the time Kennedy died, E had narrowed the difference to just 32 cumulative occurrences (53,378 to 53,346).

Had Kennedy completed his full term — and, speculatively, a second term — E would have overtaken O for the first time in American history and solidified its lead.

It is tempting to search for deeper significance in that near-miss.

But the data are dramatic enough without inventing motive for the alphabet.

E ultimately settles into a stable third position.

The Modern N Restoration (1987–Present)

In 1987, under Reagan, N retakes the cumulative lead.

This time, it does not relinquish it.

From that point forward — through Clinton, Bush, Obama, Trump, and beyond — N maintains its position at the top. What had once been a volatile rivalry stabilizes into a modern alignment.

As of the projected end of the current term in 2029, the standings are clear:

N: 67,786
O: 65,916
E: 59,190

The margin is not overwhelming, but it is steady.

After nearly two centuries of oscillation and mid-century consolidation under O, the system has returned to its founding configuration — N on top.

What Does This Reveal?

The early republic was volatile. The nineteenth century oscillated. The twentieth century consolidated. The late twentieth century realigned.

These are phrases historians already use to describe American political development.

Here, they apply equally well to cumulative orthography.

It would be irresponsible to claim deeper meaning. The letters accumulate because surnames contain them. The graph rises because time passes.

And yet, when viewed across 240 years, the pattern feels structured. A led once. O governed for decades. E nearly staged a coup. N reclaimed supremacy and has held it since 1987.

History is written by the winners.

Even when the winners are consonants.

Sunday, January 11, 2026

a's or athletics -- what a trademark dispute reveals, and why it matters to me


I’ve long been interested in sports franchise movement and name changes, particularly in Major League Baseball. So when I learned that the team formerly known as the Oakland Athletics had been denied trademarks for “Las Vegas Athletics” and “Vegas Athletics,” but approved for “Las Vegas A’s,” it immediately caught my attention.

On its face, this looks like a narrow legal story. But it touches on something much older and more fundamental: what baseball teams are actually called, who decides that, and how those decisions have changed over time.

What I called them — and what the record says

Growing up, I thought of the team simply as the A’s. I knew that was short for “Athletics,” just as I knew the Mets were short for “Metropolitans” and the Yankees for "Yankee-ee-ees." But in conversation, on uniforms, and on baseball cards, they were the A’s.

That impression was reinforced by my father. When we talked baseball, he talked about the A’s. Not the Athletics.

At some point much later, when I started doing more systematic historical work, I needed a single, consistent source of truth for team identities. For me, that source is Baseball-Reference. It’s not perfect, but it is transparent, consistent, and careful about continuity.

Baseball-Reference lists the franchise’s nickname as “Athletics” continuously from 1901 to the present. No alternation. No official back-and-forth. Just Athletics.

That surprised me at first — but I accepted it, because when you decide on a source of truth, you have to live with it.

A childhood lesson in “correctness”

The distinction mattered to me even as a kid.

I remember wanting to show off for my grandpa Ed by reciting all the major league teams in alphabetical order. There were only twenty-four teams then — sometime between 1969 and 1976 — but that detail matters only because I had memorized the list by sorting my baseball cards by team.

I knew there was one potential snag. Did I say A’s or Athletics? It mattered, because it determined whether the team came before or after the Astros.

So I asked my grandfather which was right.

Without hesitation, he said, “Athletics, of course.”

That caught me off guard. I was used to saying the A’s. My father said the A’s. But my grandfather’s answer carried a different kind of authority — as though, whatever fans said informally, there was still a sense that the proper name existed underneath.

I didn’t articulate it that way at the time, but the lesson stuck.

When team names weren’t “official” yet

Part of the confusion here comes from the fact that baseball team names did not begin as formal, declared brands.

In the 19th and early 20th centuries, nicknames were often:

  • informal,
  • media-driven,
  • situational,
  • and sometimes accidental.

Teams could have multiple nicknames at once, and newspapers freely experimented. The Cincinnati Kelly’s Killers, the Chicago Orphans, the Brooklyn Bridegrooms — these weren’t the result of branding exercises. They were labels that caught on because writers used them and readers understood them.

There was no trademark strategy. No naming committee. No press conference unveiling a logo.

From informal tradition to formal branding

Over time, that looseness disappeared.

As franchises became long-lived commercial entities, names hardened into official identities. By the late 20th and early 21st centuries, naming (and renaming) a team became a major corporate exercise, often accompanied by fan outreach, surveys, and carefully managed rollouts.

A clear example is the Cleveland franchise’s transition to the Cleveland Guardians, a process that explicitly solicited public input and emphasized deliberateness. Expansion franchises, in particular, often lean heavily on fan suggestions when selecting names, precisely because the name is now understood as a long-term asset.

In other words, the sport moved from organic, informal naming to formal, legally protected branding — and that evolution sets the stage for the current trademark dispute.

Why the trademark office cares

Trademark law has little patience for ambiguity.

“Athletics” is an extremely old name, one that predates modern trademark norms and was used by multiple teams in different cities over the decades. It is also descriptively weak: the word does not inherently distinguish one specific commercial source.

“A’s,” by contrast, is distinctive. It is visually iconic, closely associated with a specific logo, and has decades of consistent use on uniforms and merchandise. From a trademark perspective, it cleanly identifies this franchise.

Seen that way, it is not especially surprising that “Las Vegas A’s” cleared a hurdle that “Las Vegas Athletics” did not.

Why I find this funny

Here’s where this circles back to my own work — and why the situation genuinely amuses me.

For years, in my ongoing tracking project (“Stoopidstats,” which I really should trademark), I have listed this franchise as the Athletics, even though I personally thought of them as the A’s. I did that because Baseball-Reference is my source of truth, and consistency matters.

This isn’t cosmetic. I track cumulative wins — and games over .500 — by nickname.

A friend recently noticed this and thought it odd. He was sure that the team’s official name must have alternated over time between A’s and Athletics, and was surprised to learn that, according to my source, it never did.

Which makes the current situation deliciously ironic: after decades of thinking of them as the A’s but listing them as the Athletics, the franchise may now be forced, by trademark reality, to become the A’s.


What this means for my stoopidstats

From a purely statistical standpoint, this makes things interesting.

Adding Las Vegas (or Vegas, or Nevada) as a location already complicates franchise tracking. Adding Nevada as a state does too. And adding “A’s” as a distinct nickname would create something entirely new.

Right now, “Athletics” ranks third all-time in wins by nickname, with 10,302, behind only “Giants” and “Reds.” Fourth place belongs to the “Pirates,” with 10,263 wins. That 39-win margin between them will, of course change over the next few years, but when the "Athletics" name goes away (if it goes away) it is likely to still be third and "Pirates" is likely to still be fourth. But from that point on, "Athletics" will sink, and "Pirates" will likely be the first to pass it. And, of course, I’ll get to watch a new entry (A's) start with zero wins and slowly climb the rankings, passing such memorable but defunct names as "Mansfields," Tip-Tops" and "Quicksteps."

That’s not a tragedy. It’s a reminder.

Names, memory, and authority

This whole episode highlights the tension between:

  • how fans remember teams,
  • how historians catalog them,
  • and how the law insists they be defined.

I grew up saying the A’s. My father said the A’s. My grandfather insisted on Athletics. Baseball-Reference sided with my grandfather. Trademark law may ultimately side with my childhood self. And I still think "Phillies" is a lazy name, but that's a subject for a different post.

Sunday, December 21, 2025

baseball stoopidstats: wins through 2025

One of my annual rituals is checking how cumulative win totals have shifted the historical rankings. Most years, the changes are modest, which is exactly what you’d expect when you’re layering a single season onto more than a century of baseball history. Still, even small movements can be revealing, especially when they involve long-defunct teams, obsolete nicknames, or modern branding oddities.

At the franchise level, all of the changes involved active teams. That’s not surprising: each of the thirty current franchises has more cumulative wins than any one of the 150 defunct franchises, so none of the defunct fran chises could have moved. The Astros moved from 18th to 17th, passing the Angels. The Mets moved from 20th to 19th, passing the Rangers, though that “passing” comes with an asterisk: the Mets and Rangers are now tied in total wins, and I give the Mets the edge because they have fewer losses. The Marlins moved from 28th to 27th, passing the Rockies.

There was only one change in the location rankings, though it technically involved two locations switching places. “N/A,” my category for teams whose names did not include a geographic location, moved from 41st to 40th, passing Providence. This year’s Athletics season counts toward “N/A,” since the team played without a location in its name. The last time Providence appeared as a team location was 1885, so this was a case of a 21st-century naming decision nudging past a city that hasn’t had a major-league team since the 19th century.

The lone change in state rankings mirrors that shift almost exactly. “N/A” moved from 27th to 26th, passing Rhode Island. That’s no coincidence: Providence is the only location ever associated with a Rhode Island team, so once Providence slipped, Rhode Island followed.

The most activity this year came in the nickname rankings. “Mariners” moved from 28th to 27th, passing “N/A,” my category for teams that played without a nickname. The last time a team lacked a nickname was 1911, which once felt safely locked in baseball’s distant past. A few years ago, I would have said the same about teams playing without a location in their name, so clearly I should be careful with declarations like that.

In just its fourth year of use, “Guardians” jumped from 66th to 60th, passing six nicknames that are no longer in use: Hoosiers (last used in 1914), Metropolitans (1887), Cubans (1948), Orphans (1901), Club (1932), and ABCs (1938). It’s a good reminder of how quickly an active franchise can accumulate enough wins to move past names that survive only as historical curiosities. Elsewhere in the nickname rankings, “Astros” moved from 19th to 18th, passing “Mets,” while “Marlins” moved from 31st to 30th, passing “Rockies.”

Finally, a few milestones are worth noting. The Cincinnati Reds passed 11,000 franchise victories. The Boston Red Sox passed 10,000. And Pennsylvania passed 28,000 total victories for teams with locations in the state, including Altoona (6 victories), Harrisburg (151), Hilldale (282), Homestead (636), Pittsburgh (11,367) and Philadelphia (15,634).

As usual, the rankings didn’t lurch; they crept. But in those small shifts you can still see the slow accumulation of modern seasons, the fading weight of long-defunct teams, and the occasional reminder that baseball history has a way of colliding with the present in unexpected ways.

Tuesday, January 21, 2025

stoopidstats 2024: baseball's cumulative win totals

 Before I start, a couple housekeeping items:

1) This post is very late. There are various reasons for this that I'm not going to get into.
2) When presenting information of this sort, it would be good form for me to make my file accessible to the reader. I have been trying to figure out how to do that, but I have not been successful yet. Sorry. If anyone wants to see my data file, please contact me and I can email it.

That having been said, here are the relevant changes in terms of wins/losses and games over .500.

New Wins Plateaus

Several franchises, locations, states and nicknames reached new win plateaus in 2024. These are summarized below:

Ranks

The Philadelphia Phillies had 95 wins in 2024, as compared to the Boston Red Sox' 81. On the strength of that, Philadelphia moved up to the fourth-highest ranking location and Boston moved down to fifth. 

Meanwhile, the Cleveland Guardians, in their third year since changing their nickname from "Indians" to "Guardians," won 92 games. "Guardians" as a nickname is now moving up the ranks, passing nicknames that have been long out of use. It gained 15 places in the rankings in 2024.

These changes are summarized below:


Since there is no longer a franchise called the Indians, "Indians" is likely to get passed by "Dodgers" and "Braves" over the next couple of years.

2024 was, apparently, The Athletics' last year in Oakland. They're slated to play in West Sacramento for three years before moving to Las Vegas. While in West Sacramento, they will simply be The Athletics without indicating any location. Not counting the Negro Leagues, the only other time a team franchise did not have a location in front of its name was in 1877, when the team that had (from 1874-1876) been the Hartford Dark Blues became known as the Hartfords of Brooklyn. No other franchise has used the nickname "Hartfords of Brooklyn," though it does remind of "Angels of Anaheim" of recent memory. The Athletics will be the first Major League franchise in Nevada. So it'll be fun watching Nevada climb the ranks.

A Final Note

For something like this, it's necessary to have one source of truth. Mine is Baseball Reference. In their ongoing effort to get things right, they often revise information. What I noticed this year was that a lot of historical information regarding teams' nicknames. I won't try to provide a list of changes. But one example is the franchise now known as the Minnesota Twins. They played in Washington from 1901 through 1960. Until recently, BR indicated that they had been The Senators that whole time. Now, it shows them as having been The Nationals for most of the span. There are other changes, but that seems to be the biggest. 

Sunday, April 7, 2024

stoopidstats: another move!

It's been known for a while that the Athletics (baseball team) is going to be moving to Las Vegas for the 2027 season (if not sooner). That gives me something to look forward to -- StoopidStatularly thinking. The move doesn't mean a new franchise, and probably won't mean a new team nickname (the franchise has already moved twice and kept the nickname "Athletics" both times. But the move to Las Vegas promises to make them the first team there, and the first team in the state of Nevada. So that will add a level of interest (for me, anyway) to my annual process.

But this past week, baseball announced that the A's are leaving Oakland after this season. They're not moving to Las Vegas right away, since their stadium won't be ready for 2025. Instead, they'll play three years in Sacramento -- or West Sacramento, depending on which article I believe. This, of course, teases me with a variety of possibilities.

Specifically, how will the team be branded for the three interim years? Assuming they keep the nickname "Athletics," there are a few possible names for the team starting next year. As a disclaimer, let me note that I'm just a guy pulling thoughts out of his ass. I have no insider information.

Oakland Athletics: The team could, of course, keep the "Oakland" branding, which will disappoint me, since it means that nothing will be new until the move to Las Vegas. Which is where we were before last week. I think it's unlikely they'll keep this name. For starters, the Oakland fan will be feeling burned already, and keeping the Oakland branding is unlikely to assuage the bitter feelings and will make Sacramentonians will feel unappreciated and less likely to buy tickets.

Sacramento Athletics or West Sacramento Athletics: These possibilities would probably be the coolest since either one would represent a new location in the team's name. And the location would only be in use for three years (probably between 180 and 270 wins) before being abandoned for Las Vegas. These would have the advantage of creating extra merchandising opportunities as fans could gobble up the short-duration uniforms, caps and other merchandise.

California Athletics or Northern California Athletics: The franchise could go for a broader regional appeal. This would give them the same merchandising opportunities as "Sacramento" or "West Sacramento." If they use "Northern California," it would also represent a new location for my list.

Las Vegas Athletics: This would interest me to some degree, though practically speaking it would simply accelerate the "Las Vegas" moniker by three years. It wouldn't make sense to me, unless the franchise is trying to get started early on building fan loyalty. It would also annoy me because I'd be left in a quandary. If a team is labelled as Las Vegas but plays in California, I'd have to decide whether to have my statistics reflect them as being in California or Las Vegas.

As a side note, they'll be playing for three seasons in a stadium with only 14,000 seats, which is tiny by current Major League baseball standards. Of course, it's well more than enough to hold their current fan base, so I guess it should be fine.

Sunday, March 31, 2024

stoopidstats 2023: shifting ranks (win-wise that is)

 This post is way, way way overdue, since the 2024 season has already begun. For those who are interested, the equivalent post (following the 2022 season) is here.

That said, I finally updated my win/loss tables, and the rankings (by total wins) of franchises, locations, states and nicknames. The delay? Well, aside from life getting in the way, there's the fact that baseball-reference.com, which is my source for data has been updating its database. A couple years ago they (I think, following the lead of Major League Baseball) made the decision to include the Negro Leagues within the umbrella of Major League. I have heard lots of arguments for and against this decision, but the bottom line is that I (for stoopidstats' purposes) don't want to be second-guessing my source of data. At any rate, the record-keeping for those leagues left a lot to be desired. The research is ongoing, and the historical record is being revised. With the changes that occurred since the end of the 2022 season, it took me a while to get around to updating my files.

But now I'm done. And here are the changes:

By Franchise

Four teams moved up in rank. Below, I am showing how their win totals changed (along with the analogous changes for the franchises they passed. Notably, the Rangers moved up from 20th to 19th by passing the Mets. This came one year after The Mets moved from 20th to 19th by passing The Rangers. Meanwhile, congratulations to The Dodgers, The Rangers, The Brewers and The Rays!

By Location

Two locations moved up in rank. Below, I am showing how their win totals changed (along with the analogous changes for the locations they passed. Meanwhile, congratulations to Milwaukee and Tampa Bay!

By State (or State-like Entity)

No states moved up or down the ranks in 2023. Yeah, I'm almost disappointed. But it is worth noting that, as of the end of the 2023 season, Texas teams have had a grand total of exactly 4,000 wins.

By Nickname

Three nicknames moved up in rank. While two of those moved up only one place, the third ("The Guardians," in its second season as an official team nickname) moved up fourteen places. It can be expected to move up another nine or so places in 2024, but we'll see. None of the sixteen nicknames that moved down in rank have been in use for decades. The most recent uses of any of them were in 1948 -- The Homestead Grays and The Philadelphia Stars. Meanwhile, congratulations to "The Nationals," "The Rays" and "The Guardians."


Sunday, November 6, 2022

2022 stoopidstats 2: the new rankings

First of all, it's important to congratulate the Phillies. The franchise enjoyed its 10,000th win this year. They started the year with 9,935 wins, and won 87 during the year, bringing the total to 10,022.

On a similar note, the Miami Marlins won 69 games, so the geographic identifier "Miami" passed the 700 win mark, going from 653 to 722. Congratulations, "Miami"!

The Marlins and the Tampa Bay Rays combined for 155 wins. So the state of Florida, which opened the season with 3,947 wins, enjoyed its 4,000th, finishing the season at 4,102. Congratulations, Florida!

There were no new teams, and no franchise movement, so there was very little changing of ranking. But there was some. The Mets passed the Rangers to move into 19th place in wins. And "Miami," as a geographic identifier, passed "Anaheim" (which is no longer used by any team) to move into 32nd place.

But the big movement could be found in team nickname. The Cleveland franchise stopped using "Indians" after the 2021 season, replacing it with "Guardians," becoming the first ever major league franchise to use the "Guardians" nickname. They won 92 games this year, so the nickname now ranks 95th. Below are the nicknames that "Guardians" passed.

I plan to share my updated wins and games-over-.500 graphs in a future post. I find those graphs fun to look at, but they are kind of useless in terms of conveying useful information.


A note:
"N/A" is what I am using for the Chicago/Pittsburgh UA franchise from 1884. Some sources give their names as the Stogies (Pittsburgh) and Browns (Chicago). Following my general protocol, I would call them the "Stogies/Browns." But baseball-referenc.com doesn't give them a name. And since that site is my source for all truth, that is what I am going with. 

Thursday, October 6, 2022

2022 stupidstats 1: what a great regular season it has been for new york fans

Baseball's regular season is over, and for New York fans it has been a pretty good one. The Yankees finished in first place in the AL East. The Mets, after leading the NL East for most of the season, got swept by Atlanta in the last weekend, and ended up in second place*. But they did win 101 games, and are in the playoffs.

But was it the best regular season New York has had? Who's to say.

I actually started thinking about it early this summer, when the Mets and Yankees were both doing well, and seemed to have realistic shots at winning their divisions.

Spoiler alert: I decided to look at the product of the two teams' winning percentages. If, for example, both teams have completely mediocre records of 81-81, then my statistic would be .250. That is, .500 × .500.

I wanted a statistic that captured both teams' performances. Obvious candidates are combined winning percentage and total wins. Both have some advantages, to be sure. Combined winning percentage is the better of the two because it normalizes for the length of a season. If both teams do very well in a season that's shortened by a strike or a pandemic, total wins won't reflect how good a season it was.

But both teams fail in one regard. I wanted a statistic that gives a better score if both teams do well than if one does very well and the other is mediocre. For example, I consider it a better year if both teams go 100-62 than if one goes 120-42 and the other goes 80-82. Total wins and total winning percentage doesn't capture that. But mine does. If both teams go 100-62, my statistic is .381. If one goes 120-42 and the other goes 80-82, my statistic is .366.

My statistic doesn't account for post-season performance, which is why I said (above) that this has been a pretty good regular season. If you care about the post-season, and most sports fans do, the 2000 was the best season for New York baseball in the Yankees/Mets era. My statistic also doesn't account in any way for a team's position in the final standings. Both teams finishing in first place is better than one (or both) finishing out of the playoffs -- regardless of record. And I will get to that point in a bit.

Based on my statistic, this has been the second-best regular season for New York since the Mets' inception. See the following table. For statistics that combine the teams' records, each item is shaded in green if it is the best so far.


In 2022, the product of the Mets' and Yankees' winning percentages is 0.381. That's second to 1998, when the product was .382. But 1992's result was driven by the Yankees, who finished at 114-48. The Mets were respectable, finishing 88-74, in second place. But that wasn't good enough to make the postseason, so by any reasonable account, this has been a better year.

So, I am open to hearing suggestions for other statistics to measure the goodness of a regular season for two teams. Of course, the two teams don't have to be the Mets and Yankees. For Chicago fans it could be the Cubs and White Sox. Or it can be any two teams. Someone who likes the Royals and the Marlins can look at the combined statistics of those two teams. And similar analyses can be done for a combination of larger numbers of teams. For 50+ years New York had three teams between the AL and NL. There's no reason one couldn't look at them combined.

For what it's worth, this has been the best regular season in two regards: It's the first time that both the Mets and the Yankees won at least 99 games. And the minimum of their two winning percentages—0.611—is the highest it's ever been.

__________________________________________________________

*They have the same record as Atlanta, but MLB's first tiebreaker is head to head record (which, by the way, is a stupid tiebreaker -- but that's another matter), so they are officially in second place.

Sunday, September 18, 2022

longest streaks of winning seasons

 As I write this, the Yankees have won 87 games this season -- which means that they have now assured themselves 30 consecutive winning seasons.  A friend at work (who happens to be a huge Yankees fan) Noted this. He also noted that the longest streak of winning seasons ever enjoyed by a major league franchise was 39 seasons -- enjoyed by the Yankees from 1926-1964. He wondered what other teams have had long streaks. Have any others reached fifteen? Ten?

So I decided to compile a list of all streaks of ten or more consecutive winning seasons by any major league franchise. There have been thirty such streaks, all listed below:


In case you are interested in streaks of nonlosing seasons -- that is, the same analysis except including seasons where a team had a .500 record -- there are three changes to make:

The 13-season streak from 1879-1891 by the Chicago White Stockings/Colts becomes a 14-season streak from 1878-1891

Add in a ten-season streak from 1975-1984 by the Philadelphia Phillies.

Add in a ten-season streak from 2003-2012 by the Philadelphia Phillies.

Make of it what you will.

Monday, January 31, 2022

baseball stoopidstats: wins and losses through 2021

 I'm a bit late on this, since spring training starts soon -- or would start soon if not for the lockout. But I finally assembled my annual analysis of baseball's cumulative win totals, games over .500 and ranking (of win totals) for all of major league baseball. To remind, I do these by franchise, by location (as indicated in the team's name), by state or state-like entity, and by team nickname.

The job was more complicated this year because of the decision, made last year, to include some of the Negro Leagues as Major League. This meant the addition of 64 franchises that were never before listed as Major League. I am using baseballreference.com as my source of data and of truth. So I didn;t decide whether to include the Negro Leagues, or which leagues in what year to include. I don't know how baseballreference decided. Maybe the offices of MLB decided and br just accepted their decision. I don;t doubt that more Negro Leagues will be added in the years to come. Among those that were included were several teams that had two home locations at once, and some that had no location indicated in their names. For those with no location (e.g., the "Cuban Stars West"), I indicated "N/A") For those with two locations, I created new categories such as "Indianapolis/Detroit" which necessitated new listed states such as "Indiana/Michigan." It's not perfect, but that's what I did since the data don't neatly fit the structure that I had built.

Adding the new data presented new challenges as well, in that Excel is kind of choking on the volume of data. I hope that my next computer is better able to handle it. But because of the issues I ended up recreating my file from the ground up. The bright side? I figured out more-efficient ways of building the file. Things that go in the realm of "Duh, why didn't I think of that before?"

As always, I used baseballreference.com as my source for data. I ran into a few data issues:

  • Adding up the records for all teams in 1890, there were 1580 wins, 1581 losses and 61 ties. This is mistaken on its face, but I have no better source to go with. So that's what I have.
  • Similarly, in 1928 the records add up to 1614 wins, 1614 losses and 19 ties.
  • Similarly, in 1933 the records add up to 1379 wins, 1379 losses and 27 ties.
  • Similarly, in 1942 the records add up to 1499 wins, 1500 losses and 30 ties.

In creating the rankings by wins, I used games over .500 as the first tiebreaker and ties as the second tiebreaker. I still ran into a few ties which I did my best to resolve in a logical manner, such as which team preexisted the other.

I am not including the full file here -- actually, I don't know how to embed an Excel file in a blogpost (assuming it's even possible). But if anyone is reading this and wants the file, feel free to contact me and we'll figure something out.

Some of the graphs are at the bottom of this post. I freely admit that this is an exercise in bad data presentation, but I like the way the graphs look.

But before the graphs, some congratulations are in order.

The Miami Marlins went 67-95, pushing Miami (the location) to 653 wins, which was enough to move up two rankings to 33rd. It passes Indianapolis (638 wins, most recently 32 in 1948) and Homestead (629 wins, most recently 44 in 1948). Congratulations, Miami.

The Tampa Bay Rays went 100-62, pushing the name "Rays" to 1,181 wins, which was enough to move up one ranking to 37th, It passes "Monarchs" (1,120 wins, most recently 60 in 1948). Congratulations, "Rays."

The Houston Astros went 95-67, pushing the name "Astros" to 4,529 wins, which was enough to move up one ranking to 19th. It passes "Browns" (4,488 wins, most recently 54 in 1953). Congratulations, "Astros."

The New York Mets went 77-85, pushing the name "Mets" to 4,551 wins, which was enough to move up one ranking to 18th. It passes "Browns" (same as above -- yes, "Browns" moved down two rankings). Congratulations, "Mets".

The Kansas City Royals and The Milwaukee Brewers each passed the 4,000 win mark (for the franchises). The name "Athletics" passed the 10,000 win mark (for the name). The names "Brewers" and "Royals" passed the 4,000 win mark (for the names),

The Cleveland Indians name is being changed to Cleveland Guardians effective this year. Our cultural zeitgeist being what it is, I don't see another franchise calling itself "Indians" in the foreseeable future. So that name stops making progress at 8,532 wins. This year will be the first time there's a Major League team called "Guardians."

And now for some graphs:

Wins by franchise:

Wins by location:

Wins by state:

Wins by nickname:

Games over .500 by franchise:

Games over .500 by location:

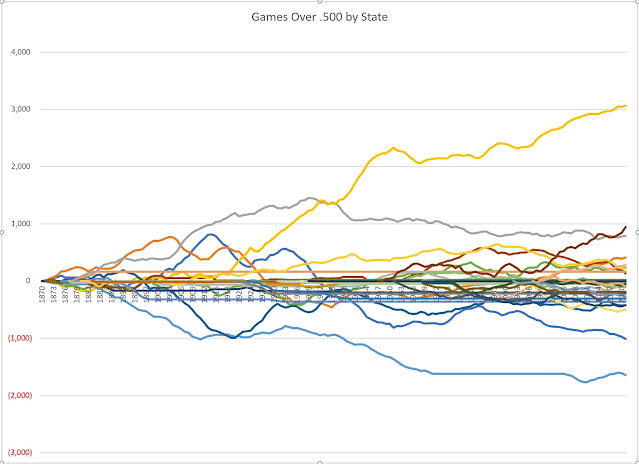
Games over .500 by state:

Games over .500 by nickname:


You're welcome


Sunday, November 28, 2021

stoopidstats: hits in n-year spans

I recently posted the first of my 2021 baseball stoopidstats posts. It was about the set of records for most homes run in an n-year span for positive integers n.

Stoopidstats enthusiast Emily Terwilliger Levatte suggested that it would be interesting to see the same treatment for hits. So here we are.

The process is essentially the same, and there's no reason it can't be performed for hits -- or strikesout, RsBI, triples, or any other discrete stat. That said, it did take longer to do hits than homes run. That's just a consequence of the numbers. I have a well defined process for deciding what players' careers to look at. Assuming I apply it correctly, I can rest assured that I haven't missed anything. When I was looking at homes run I had to consider 24 players' careers. For hits I had to consider 65.

Anyway, none of the records has changed since 2013. That was the year Ichiro Suzuki set the record for most hits in a 13-year span. The records are summarized below.


Friday, November 26, 2021

stoopidstats: homers in n-year spans (again)

 It's been quite the busy fall, so I have fallen behind in my annual ritual of updating my baseball stoopidstats. But I got the first bit out of the way: my annual update of the set of records for most homes run in an n-year span (for positive integers, n).

People may be interested -- or not -- to learn that, once again none of these records has changed. There was a flurry of change in these records during the steroid era, but it's been well over a decade since any of the records changed. The records -- all aleph-null of them are held by four players -- Barry Bonds (who last played in 2007), Mark McGwire (2001), Sammy Sosa (2007) and Babe Ruth (1935). So obviously, none of these records has changed since at least 2007.

But, for the record, here they are:


Thursday, July 8, 2021

stoopidstats: wins/losses graphs update for the negro leagues

Before I start, let me acknowledge that the graphs which are an important visual part of this post are not good examples of data visualization. Some are completely worthless for gleaning information. The others are mostly worthless. But I had fun making them and have fun looking at them.

At some point last year Major League Baseball announced that the Negro Leagues, or at least some of them, would be recognized as Major League. In keeping with that pronouncement Baseball Reference, one of my main sources of information for my baseball stoopidstats has added Negro League baseball to its Major League records. You can read about that decision here. At this point, they are including 64 franchises in seven leagues, covering the years 1920-1948. Based on what they've written I am expecting that this is only the first step, and more Negro League baseball will be added to the Major League record in the future. What's holding them back is that the data are hard to come by and research is taking time.

At any rate, this all affects my stoopidstats. Specifically, my big wins/losses charts I had to update them to recognize this new official information. There are twenty major graphs, all of which can be seen below. But first, some commentary.

I have five graphs that show data by franchise. There have been 180 franchises, so each of these five graphs has 180 data series. The five are as follows:

  • cumulative wins;
  • cumulative wins, but with each series truncated after its franchise' last year of existence;
  • cumulative games over .500;
  • cumulative games over .500, but with each series truncated after its franchise' last year of existence;
  • rank (by cumulative wins.
After that there are five analogous graphs, each grouping franchises by location (as indicated in their team name). Note that, even though Brooklyn is in New York, Brooklyn and New York have separate series -- just as Los Angeles, Anaheim and California are each separate series. Of course, as teams moved (or changed the location indicated in their names), their data go into different series. For example, consider the existing franchise currently known as the Los Angeles Angels. Their data from 1961-1964 and from 2005-2020 are part of the "Los Angeles" series. Their data from 1965-1996 are part of the "California" series. Their data from 1997-2004 are part of the "Anaheim" series.

After that there are five analogous graphs, each grouping franchises by home state. For these purposes, I am considering the District of Columbia, Quebec and Ontario as states. For this reason I sometimes say "state or state-like entity."

Finally there are five analogous graphs, each grouping franchises by nickname.

The Complications
Adding the Negro leagues to my project presented me with some new issues.

The first issue is technological. My file uses a lot of the "sumifs" functions in Excel, which (I understand) are taxing on Excel. I also use a bunch (though not as many) of "rank" functions. I would imagine that they are also taxing on Excel, but I may just be talking out my ass. In addition to the number crunching, there are five graphs with 180 series, five graphs with 155 series, five graphs with 75 series, and five graphs with 38 series. And each series in each graph covers 150 years. Before I added the Negro League information, the file seemed to be working fine. I guess the extra pushed it over the edge, because with all the extra information the file started reacting very slowly. At Meep's suggestion, I broke the file in two. One file does the number-crunching and the other does the graphing. It's not ideal, but what is?

The second issue has to do with team names and locations. Without the Negro Leagues, each team had one home location in each year*. Teams all had names of the form The <location> <nickname>, or names that could be shoehorned into that format. But the Negro Leagues had some franchises that had no home park and didn't identify a home location (e.g., the "Cuban Stars West"). For those I introduced "N/A" as a location and as a state. There were also quite a few teams that split time between two cities. I don't have it in me to try to break down all of their games between multiple locations; given that they also played away games, I think such attributions would be near-impossible if not completely impossible. For these, I am recognizing locations and states such as "Cincinnati/Indianapolis" and "Ohio/Indiana." I don't like to do it, but I see no better alternative.

Finally, I noticed some data inconsistencies. Every time a team wins a game, another team loses. And every time there's a tie game**, two teams register a tie. So, in each year (and, until 1993, each league in each year) registered the same number of wins and losses and an even number of ties. But that is not reflected in the statistics in Baseball Refence. According to BR:
  • The 1890 American Association had a combined record of 525 wins and 526 losses.
  • The 1942 Negro National League had a combined record of 156 wins and 157 losses.
  • The 1890 American Association had 29 ties.
  • The 1928 Eastern Colored League had 9 ties.
  • The 1933 Negro National League had 7 ties.
The statistical mistakes in the Negro Leagues are probably a result of incomplete records. Hopefully they will be corrected as more research is done. The 1890 American Association numbers are curious. In a prior iteration I did not see this issue. This means that the record was updated to something that clearly has an error. All this said, I don't have any basis to reflect numbers different than what is in BR.

Finally, I note that, in ranking franchises, locations, states or nicknames by win total, there are inevitable ties. My first tie breaker is ties (on the theory that a ties is sort of half a win). My second tie breaker is games over .500 (on the theory that getting to n wins with x losses is better than getting to n wins with y losses if x<y). My final tiebreaker is which team/location/state/nickname got to that number of wins first (on the theory that I had to do something).

And now, without further ado, the graphs:


________________________
*With one exception. The 1884 Union Association had a franchise that moved from Chicago to Pittsburgh during the season. For an earlier version of the file I researched to determine how many wins and losses are attributable to the team in each of its locations.
** Honestly, in the context of baseball, I am not exactly sure how ties occur. Ties were more frequent in the early days of the game, but they do occur in modern times. The last tie was in 2016. It involved the Cubs and the Pirates. If you want to research to find out what happened, please let me know.

Saturday, April 3, 2021

stoopidstats: what players lasted for the most presidents?

 There's a member of the Twitterati whom I follow, who goes by the name of PrezWisdom*. You can find him here. As near as I can tell, his three main interests are (not necessarily in order) presidential history, baseball and Cleveland sports. We sometimes chat presidential trivia, and sometimes baseball. And when it's baseball, it somehow gets to stoopidstats.

So he asked me if I know what's the most presidents spanned by any one baseball player's major league career. He threw out several names of players whose careers spanned seven presidencies, but he wondered if there were any players whose careers spanned eight or more presidents. He knew that such a question would pique my interest. And, with the aid of a downloadable baseball database, I had at it.

I found two players -- Jim O'Rourke and Arlie Latham -- whose careers spanned nine presidencies. And there are three -- Dan Brothers, Cap Anson and Nick Altrock -- whose careers spanned eight presidencies. Unfortunately, things are never quite that easy, and the answer is subject to two questions of how to count:

  • Suppose a player took off some years before coming back, and those off-years included the full term of a President's administration. Do you count that President? To illustrate with a hypothetical, suppose a player made his debut in 1976 (when Gerry Ford was president), then didn't play again until 1981 (when Ronald Reagan was president). Do we consider his career as spanning three presidents (Ford, Carter, Reagan) or only two (Ford, Reagan). I prefer to say three, but it's purely a definitional issue and I can see an argument for two.
  • Grover Cleveland served two nonconsecutive presidential terms. By most reckoning, these are considered two separate presidencies. For these purposes, are they two presidencies or one? I prefer to say two.
In the chart below, I list all players whose careers spanned at least seven presidencies (by any combination of answers to the above questions). There are 13 players on the list -- if I extended it to six presidencies, there would be another 63 players on the list. For each player, I provided the number of presidents assuming all four combinations of answers to the two questions.


In the interests of completeness, I note that I used a 2019 database. One might wonder if counting players' activity in 2020 or 2021 would change my conclusions. I actually mentioned this to PrezWisdom in regard to the new season -- anyone playing this year (as I write this, we are in the season's third day) adds another President to his career. But PrezWisdom pointed out that it won't affect the longest spans. We recently had three consecutive two-term Presidents, so anyone playing this year and counting Biden as his seventh President would have had to made his debut no later than 1988. While I don't follow baseball particularly, I would be aware if there were an active player who had played in the 1980s. Similarly, if there had been a player who played last year (and only then added Trump as his seventh president) would mean that he had made his debut no later than 1980 (and not played in 2017-2019). Again, I would have been aware of such a player.

______________________

*No, I don't know his real name.

Friday, January 8, 2021

25a? impeachment? how does that affect my stoopidstats?

After the disgraceful events of Wednesday, egged on my President Trump, there's renewed interest in impeaching him again (and this time convicting him and removing from office) or removing him via Section 4 of the 25th Amendment (25A§4).*

I'm not here to opine on the relative merits of the two courses of action. But I'm a bit of a process geek, and I also have my weird StoopidStats thing. So on that basis alone I'm kind of fascinated by the possibility of Pence becoming president for less than two weeks. He would go down in history as the shortest-serving president (passing William Henry Harrison who served for a month), and his presidency would likely be of little consequence -- other than the symbolism of Trump being forced from office. But the history books would record that he was President.

But then I started wondering -- can it really happen?

The impeachment route would require both houses to reconvene. The House of Representatives would have to vote to impeach, and the Senate would have to have a trial** and convict. My understanding is that both houses have the necessary votes. I suppose it could be accomplished in the few days left. But that would require all parties to act quickly. Given the logistics, I don't see it happening in time to remove Trump from office before Biden is sworn in.

That leaves 25A§4. Before I address this, let's look at the actual language. But first, note that this interpretation is my own, and I am not a lawyer.

Whenever the Vice President and a majority of either the principal officers of the executive departments or of such other body as Congress may by law provide, transmit to the President pro tempore of the Senate and the Speaker of the House of Representatives their written declaration that the President is unable to discharge the powers and duties of his office, the Vice President shall immediately assume the powers and duties of the office as Acting President.

Thereafter, when the President transmits to the President pro tempore of the Senate and the Speaker of the House of Representatives his written declaration that no inability exists, he shall resume the powers and duties of his office unless the Vice President and a majority of either the principal officers of the executive department or of such other body as Congress may by law provide, transmit within four days to the President pro tempore of the Senate and the Speaker of the House of Representatives their written declaration that the President is unable to discharge the powers and duties of his office. Thereupon Congress shall decide the issue, assembling within forty-eight hours for that purpose if not in session. If the Congress, within twenty-one days after receipt of the latter written declaration, or, if Congress is not in session, within twenty-one days after Congress is required to assemble, determines by two-thirds vote of both Houses that the President is unable to discharge the powers and duties of his office, the Vice President shall continue to discharge the same as Acting President; otherwise, the President shall resume the powers and duties of his office.

If you're interest is in the symbolism of the first ever invocation of this procedure, then have at it (assuming you can get Mike Pence and a majority of either the Cabinet or the appropriate Congressional body to start the process). But for the Stoopidstats geek like me, it won't matter. Trump would remain President until his term expires this month.

To see why, consider the language quoted above. There are, essentially three steps (as described below). For brevity, I am not reiterating the timing involved, and I'm further editing the language. If you don't trust me, read the actual language above.

  1. The VP and a majority of either the Cabinet or the appropriate Congressional body send a letter to the House and the Senate a declaration that the President is unfit. At this point, the President is stripped of his duties and responsibilities. The Vice President becomes "Acting President," and assumes the duties and responsibilities. But the President does remain President -- this is made clear by the language at the beginning of the second paragraph that still refers to him as the President.  
  2. The President sends a response saying that he is fit.
  3. The VP et. al. reassert that the President is indeed unfit.
  4. Congress decides the matter and either the President is removed (at which point the VP becomes President), or the President resumes his duties and responsibilities.

For President Trump to be removed from office, all three steps of the process would have to play out. That is just not going to happen in the time remaining. In fact, the language of the Amendment doesn't specify how long the President can take before responding. So President Trump could simply shrug, go golfing, and spend his remaining time as a powerless and dutiless President. But he would still be President. Given the short time involved, I suspect that's what he'd do.

So I could be proven wrong, but I doubt that Trump will be removed from office before the end of his term.

At any rate, the process of 25A§4 brings up an interesting question. Well, it's interesting to me, anyway. Suppose a President is inaugurated as scheduled, and then 25A§4 is invoked later that day. Can the President refuse to respond for four years and effectively spend a full term as a powerless President?

Further (and, yeah, I know this is deep within the realm of crazy), suppose that happens but our powerless President somehow gets reelected. Does his powerless status continue? Or does he get his powers back with the second inauguration? If the former, suppose he is not reelected, but is then subsequently elected to a second nonconsecutive term. Does he get his powers with that second term?

One final note: If Trump is removed from office before the end of his term, that will slightly improve his "SCOTUS Days Ratio," which is a statistic I invented to measure a president's influence on the Supreme Court as a function of his time in office. I defined that statistic here.

______________________________

*Most discussion of this issue seems to refer simply to the 25th Amendment without specifying which section. 25A covers other presidential replacement/succession issues (such as death or resignation). Sections 1, 2 and 3 have all been invoked at least once. I prefer to refer to 25A§4 to make clear that I am specifically referring to Section 4.

**What a "trial" consists of is left to the Senate to decide, so it could be very very quick.

Sunday, December 20, 2020

negro leagues as mlb -- my task ahead


I can't say that I was surprised to learn that Major League Baseball has decided to recognize the old Negro Leagues as "major" and integrate those leagues' records into its "official" history. Anyone with any sense of how the wind blows could see it coming. My purpose here is not to opine on the merits of such a move. I don't think I can really add any extra light to the discussion. 

But, from the perspective of my StoopidStats I am looking forward to this with a mix of excitement and trepidation. As anyone who regularly reads this blog knows, I like to track offbeat baseball statistics. Decades ago I got it in my head that I wanted to see a graph showing all major league franchises and their year-by-year cumulative games over .500. At the time that I first envisioned it, the limitations of data avilability and computing power meant that putting such a chart together was beyond what I could easily do. Now, it's much easier -- a big file that's conceptually pretty simple and easily updated every year. My last post about that project was here. Since then, I came up with other ideas -- the records for most home runs in N consecutive seasons (for positive integers N) is prominent among them.

When Negro League statistics are merged into MLB history, I will have the task of updating my statistical research. That'll be the fun part, but it can't commence until and unless my sources -- baseball-reference and various downloadable databases are updated. Hopefully the updates will be controlled in such a way that my various sources stay in sync.

But there will be challenges -- some that may force an end to some of what I track. I've been working with the construct that all teams have what I will call a full name -- location nickname. For example, we have the New York Yankees, the Pittsburgh Pirates and the Texas Rangers. Some of the statistics that I track depend on that name structure. But the Negro Leagues included teams such as the "Cuban Giants" which doesn't indicate its location, and teams such as the Homestead Grays who split some seasons between Homestead Pennsylvania and Washington, DC. These will present new challenges for me. I'll not worry about that now. Afterall, I assume part of the work that the various Lords of the baseball world will undertake will involve determining which Negro Leagues and which teams will be accepted as "officially" major league. Instead of trying to pre-solve every issue that can arise, I'll see what issues do arise and worry about those.

Sunday, November 22, 2020

home run leaders by presidential administration

One of the Twitterati I follow wished his favorite baseball player a happy birthday. And noted an achievement. Of course, PrezWisdom subsequently noted that Griffey doesn't actually hold the record cited in that tweet. Alex Rodriguez owns the two-term record for most home runs hit during a presidency, with 364 during the administration of George W. Bush. PrezWisdom prefers not to acknowledge Rodriguez because the latter is an admitted steroid user. The wacky-face emojis tell me he has tongue firmly planted in cheek.

Anyway, that got me to thinking...

Who holds the record for one term presidencies? For partial-term presidencies. Aw, heck...who hit the most home runs in each presidential administration since the advent of Major league Baseball? Is there a way to look that up? This sounds like a job for stoopidstats!

The full table is below. But first a few comments.

For the purposes of this task, it's fortunate that the normal succession date of January 20 is during the offseason. Even before it was moved to January, it was in early March which was during the offseason. Thus, for the most part the task is easy. With a downloadable database (I use Sean Lahman's), it's mostly a matter of simply pivoting on sets of years (e.g., for Wilson, see player totals for the years 1913-1920). The complications come in on the few occasions where presidential succession occurred during a season. As necessary for those seasons, I used the game logs available on Baseball Reference to determine who hit how many home runs during whose presidencies. Fortunately, I never ran across a situation where a contender for a lead actually hit a home run on the day that the presidency changed hands. I'd have hated trying to research times of day to see if I could figure out things like "did he hit that homer before or after President Whosiwhats died.

Even so, I couldn't get full information. Baseball Reference doesn't seem to have game logs from the 19th century. So I was left high and dry trying to parse who hit how many homers when during the 1881 season. President Garfield died during that season. Garfield's presidency was the second-shortest, running from his inauguration on March 4, 1881 until his death on September 19, 1881. 41 players hit homers in 1881, led by Dan Brouthers, who hit 8. But without a game log I can't say definitively who hit the most while Garfield was president.

Similarly, the lack of game logs for 1881 means that I don't have full information for President Arthur. Ned Williamson hit 32 home runs in 1882-1884. He also hit one homer in 1881. No one else hit more than 31 during 1881-1884, so Williamson has the most. But I don't know if his total is 32 or 33.

A few other fun facts before I show the full list. Please note that, in these fun facts, I am sadly leaving out whoever it was who had the most homers during Garfield's presidency:
  • The only tie came during Grover Cleveland's first presidency. Yes, I treated his two nonconsecutive terms as separate presidencies. Dan Brothers and Roger Connor each hit 39 homers during the Cleveland I administration.
  • Babe Ruth and Mike Schmidt are the only two players who led in homers during more than one administration. And they each did it for three.
  • Even though Franklin Roosevelt served more than three terms, Jimmie Foxx's administration-leading total of 353 home runs falls short of Alex Rodriguez' 364 home runs during George W. Bush' presidency. In fairness, Roosevelt died so early during his fourth term that no baseball had been played. So, for these purposes, it's the same as if he had only served three terms.
  • Maybe PrezWisdom can take comfort in the knowledge that Griffey's home run total during the Clinton administration might have topped Rodriguez' total during the Bush administration if not for that strike in 1994-1995. Or maybe that makes it worse.
a) insufficient information available to determine. Dan Brouthers hit 8 home runs in 1881, but it is unclear how many he hit during the Garfield presidency.
b) Ned Williamson hit one home run in 1881. It is unclear whether that was before or after Arthur assumed the presidency.
c) Includes all 12 of the home runs Freeman hit in 1901. All 12 were hit before McKinley's death.
d) Does not include any of the 8 home runs Davis hit in 1901. All 8 were hit before McKinley's death.
e) Includes the 25 home runs Ruth hit in 1923 before Harding died. Does not include the 16 home runs he hit in 1923 after Harding died.
f) Includes the 16 home runs Ruth hit in 1923 after Harding died. Does not include the 25 home runs he hit in 1923 before Harding died.
g) Includes the 15 home runs Aaron hit in 1974 before Nixon resigned. Does not include the 5 home runs he hit in 1974 after Nixon resigned.
h) Includes the 11 home runs Schmidt hit in 1974 after Nixon resigned. Does not include the 25 home runs he hit in 1974 before Nixon resigned.