For the most part, in Keith's home-taught cinema-history class we screen one movie each week. There have been two exceptions -- during the role-reversal weeks Joe made presentations that involved TV episodes.
Well, last Thursday became another exception. An hour and a half of movie trailers. I can't even begin to try to list the films whose trailers were included. Except for The Virgin Witch. That one I remember.
Watching a long program of trailers is definitely a different experience than watching one movie. In many ways it was enjoyable. Instead of one story we got a few dozen. And many of these trailers were likely better than the movies themselves. It was actually a lot of fun, acting as the crew in a MST3K episode, tossing out barbs and heckling the screen. And it also served to provide ideas for what we'd like to see. "Hey, Keith, add this one to the list" was a constant refrain. And it's definitely useful to get a sense of the sensibilities that were at play in the film industry.
Joe suggested making this an annual tradition, and I think that's going to happen, which will make this the class' third tradition. The other traditions being our month of spaghetti westerns and our role-reversal month (which I have generally referred to as bring your own month).
Monday, November 7, 2016

Sunday, November 6, 2016
more stoopid stats: world series drought edition
 |
| Table 1: The 30 longest droughts |
First of all, I should note that I take issue with the fact that people are saying that the cubs ended a 108-year drought. They last won the World Series in 1908. By that logic, when a team wins the WS for the second time in a row, they are ending a one-year drought. That being the case, I think it's more appropriate to say that the Cubs ended a 107-year drought. But who am I to fight the world? Since I can't find the world, I am accepting that a drought's length is X-Y where X and Y are years that the team in question won the World Series, and they didn't win in any intervening year. Where X is the team's first win, I take Y to be 1902 (the last year before the inception of the modern World Series. Where Y is the team's most recent win, I take X to be 2016 (the current year). Although baseball's championship was called the World Series during some years in the 1800's, I am only considering the modern World Series, which began in 1903.
Now that the Cubs' drought is over, the longest active drought belongs to the Indians who are stuck in a 68-year jag. There have been a total of 141 droughts, which is equal to F+P-1 where F is the number of franchises (30) and P is the number of World Series played (111). That includes 23 one-year droughts which, per above, represent a team winning the series a second, third, fourth or fifth time in a row. Table 1 shows the 30 longest droughts, and table 2 shows each franchise's longest drought. A note about the second table -- there are 31 entries because the Cardinals have had two 24-year droughts, which are tied for the franchise's longest.
 |
| Table 2: Each franchise's longest drought |
Droughts these days are necessarily longer than droughts from years past, simply because there are more franchises. With 30 teams, each one wins, on average, once every 30 years. When there were only 16 teams, each one won, on average, once every 16 years. I should put something together that normalizes adjusts drought length for the number of teams. The task is made more difficult by the fact that many of these droughts span years that included expansions. So it's not as if I can multiply each drought's length by a simple factor. More troubling is how to handle the two years (1904 and 1994) that didn't have a World Series. I am open to suggestions.
Wednesday, November 2, 2016
baseball stoopid stats (2016 edition) #4: wins, losses and games over 500 (by state)
I presented a chart of all major league baseball franchises and their cumulative games above .500 (along with a table of active franchises ranked by wins) here.
 Then I combined the franchises based on the geographic location indicated in their names. That chart and table are here.
 For my third trick, I combine the teams based on their home state. Note that for these purposes I treat the District of Columbia, Quebec and Ontario as if they are states. To date, 28 states have had major league franchises. Of those, 19 had at least one franchise in 2016. The winningest, New York, has had 27,614 wins and stands 3,279 wins over .500 -- thanks largely to the Yankees and their significantly winning record. In 28th is Iowa, whose only major league team, the Keokuk Westerns, went 1-12 in 1875.
 Then I combined the franchises based on the geographic location indicated in their names. That chart and table are here.
 For my third trick, I combine the teams based on their home state. Note that for these purposes I treat the District of Columbia, Quebec and Ontario as if they are states. To date, 28 states have had major league franchises. Of those, 19 had at least one franchise in 2016. The winningest, New York, has had 27,614 wins and stands 3,279 wins over .500 -- thanks largely to the Yankees and their significantly winning record. In 28th is Iowa, whose only major league team, the Keokuk Westerns, went 1-12 in 1875.
While New York and Pennsylvania are ahead in wins, it's only a matter of time before California, with five franchises, passes them. Barring changes in the the number and/or locations of teams, that is. New York and Pennsylvania are ahead simply because they each had three teams for the majority of the 20th century, and two teams for most or all of the rest. California didn't hava franchise until 1958 when the Dodgers and Giants moved there. It expanded to three with the inception of the Angels in 1961, then to four when the A's moved to Oakland in 1968 and five when the Padres were introduced in 1969.
By the way, in 2016 Florida (with two teams) passed Washington (one team) to move into 15th place.
Tuesday, November 1, 2016
baseball stoopid stats (2016 edition) #3: wins, losses and games over 500 (by location)
In my last post, I presented my graph of the cumulative games above 500 stat for every major league baseball franchise. That post was here.
One thing that I didn't mention is that I also track wins, losses and games over .500 by location. That is, grouping franchises by the location indicated ion their names. the "New York Yankees" are part of New York. The "Texas Rangers" are part of Texas. Note that, in this scheme, some franchises have different parts of their records attributed to different locations. For example, the Dodgers' record through 1957 is part of Brooklyn. Their record since 1958 is part of Los Angeles. There have been 54 different locations represented in the major leagues, and the graph is as follows:

 The locations, listed in order of wins (most to least) is at right. Among locations that no longer have a franchise, the one with the most wins is Brooklyn.
One thing that I didn't mention is that I also track wins, losses and games over .500 by location. That is, grouping franchises by the location indicated ion their names. the "New York Yankees" are part of New York. The "Texas Rangers" are part of Texas. Note that, in this scheme, some franchises have different parts of their records attributed to different locations. For example, the Dodgers' record through 1957 is part of Brooklyn. Their record since 1958 is part of Los Angeles. There have been 54 different locations represented in the major leagues, and the graph is as follows:
 The locations, listed in order of wins (most to least) is at right. Among locations that no longer have a franchise, the one with the most wins is Brooklyn.
 Sunday, October 30, 2016
baseball stoopid stats (2016 edition) #2: wins, losses and games over 500.
As promised, here is another edition of stoopid stats for Major League Baseball. It has been noted to me that I really should provide access to the underlying spreadsheet. I don't deny that. And I offer my apologies to anyone who wants to look at it and can't. At some point I'll be up to doing such things.
Sometime around 30 years ago I started thinking about how cool it would be to see a massive graph

Sometime around 30 years ago I started thinking about how cool it would be to see a massive graph
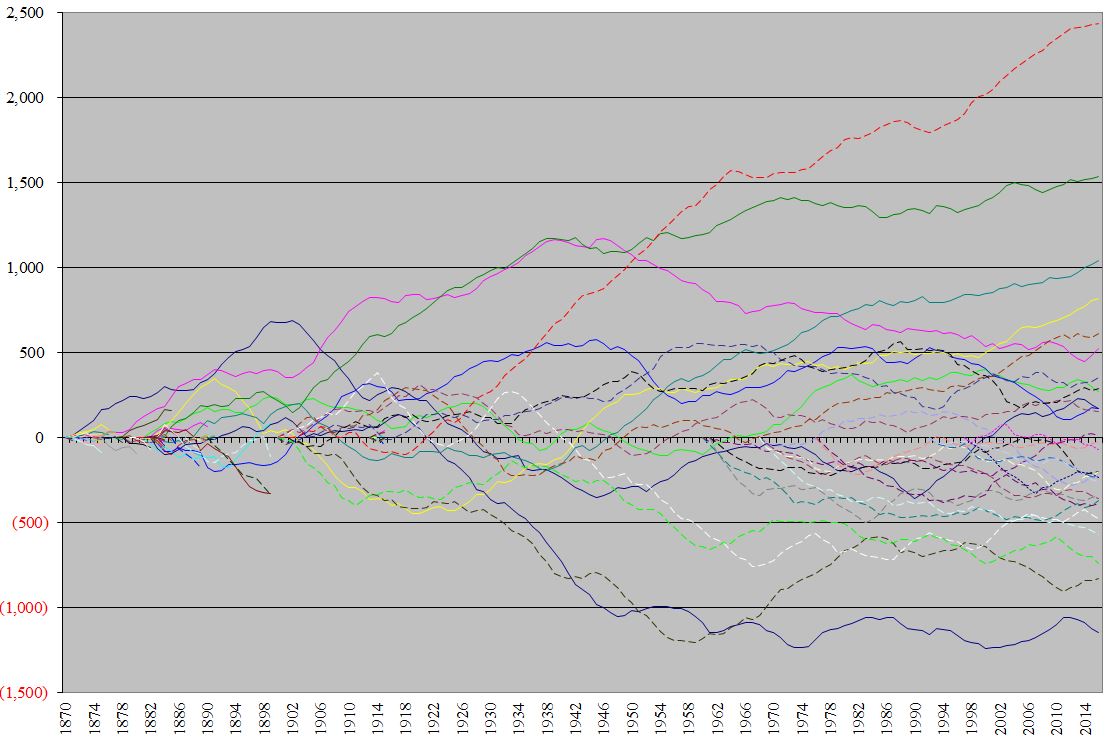 |
| Cumulative won-loss totals for every major league franchise |
showing every major league team's cumulative games above .500 (i.e., wins minus losses), as that stat progressed from year to year. It was impractical to undertake such a project without using a spreadsheet, so I didn't really pursue it until Lotus 123 (or am I dating myself) became one of my everyday tools. Now I have a spreadsheet tracking this, which I update every year.

The graph (as it exists as of 2016) is above. Another acknowledgement: It would be great to have a legend. But it wouldn't be that great. There have been 113 franchises (including defunct ones), so a full legend would be largely useless. But, for what it's worth, that red line at the top is the Yankees, who have (by far) the best record.
Of course, that doesn't mean that the Yankees have the most wins. They are actually eighth by that measure. Of course, fifteen franchises are older than they are. The eight non-expansion NL teams all date to the second half of the 1800s. The other seven non-expansion AL teams date back to 1901. The Yankees date back to 1903 -- the year they entered the league, replacing the AL Baltimore Orioles. Ranking the teams by win totals give us the table at right. For these purposes I am only including the current 30 teams. If you really want to see this table, including all 83 defunct franchises, let me know. But among defunct franchises, the one with the most wins was also the Baltimore Orioles who played in the AA from 1882-1891 and the NL from 1892-1899, compiling a record of 1,133 and 1,049. And they had fewer wins than the Rays who are behind the rest of the Major League pack.
Of interest (at least to me), the Yankees entered the 2016 season with exactly 10,000 wins. I actually hadn't noticed until after this year. That's because, until now I've been treating the 1901-1902 Orioles and the current Yankees as the same franchise. That was my understanding, based on the sources available when I started this project a couple decades ago. But in recent years the baseball historians reexamined the history and concluded that the replacement of the Orioles with the Highlanders (who would eventually come to be called the Yankees) really involved the dissolution of one franchise and creation of a new one. I don't know the exact criteria they used, or exactly how they arrived at that conclusion. I imagine it's as much art as science. But I'm going to accept their judgement. Problem is, that involves modifying my files.
Also, in 2016 the Dogers passed the Braves to become the third winningest franchise.
Subscribe to:
Posts (Atom)